Visualizing The Vesicle
Visualizing arbitrary frames of the vesicle trajectory can be insightful for discovering new phenomena, as well as just being an easy check to see if the simulation is behaving physically. Included in this analysis are two visualization tools:
VMD tcl scripting
gnuplot scripting
VMD tcl Scripting
Opening the trajectory in VMD is good for detailed investigation of the vesicle’s topography as this renders the vesicle as a 3D interactable scene. Loading an entire trajectory allows for creation of 3D animations.
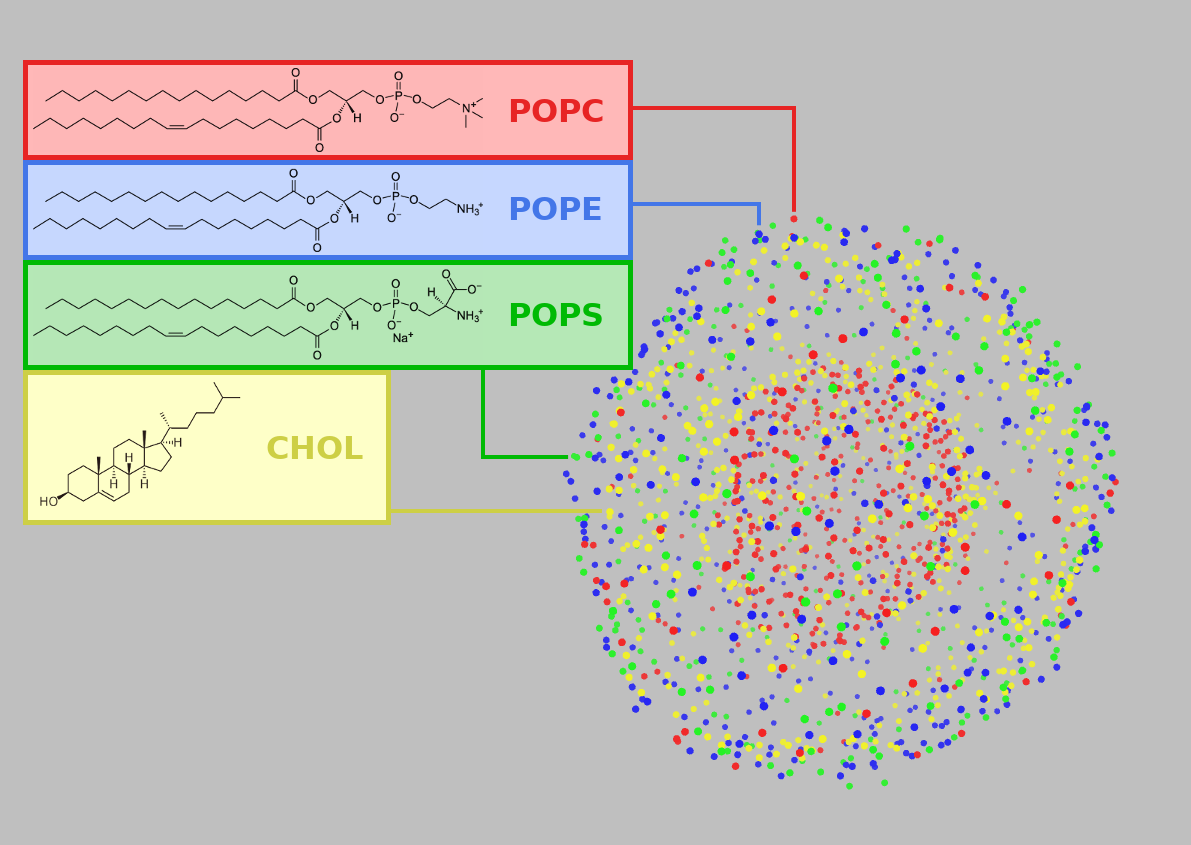
Settings to control how points (e.g. phospholipid heads) are rendered can be store in a tcl script such as lookAtVesicle.tcl and reused later. For a frame, example_frame.pdb, for instance, VMD can open the file, load the settings, and display using this command:
vmd example_frame.pdb -e <(echo "source lookAtVesicle.tcl")
See also
- Using VMD
A tutorial for VMD and tcl scripting
gnuplot Scripting
Projecting the vesicle onto a map as a 2D image with gnuplot is good for creating easy-to-share graphics. Doing this for many consecutive frames allows for creation of 2D animations.
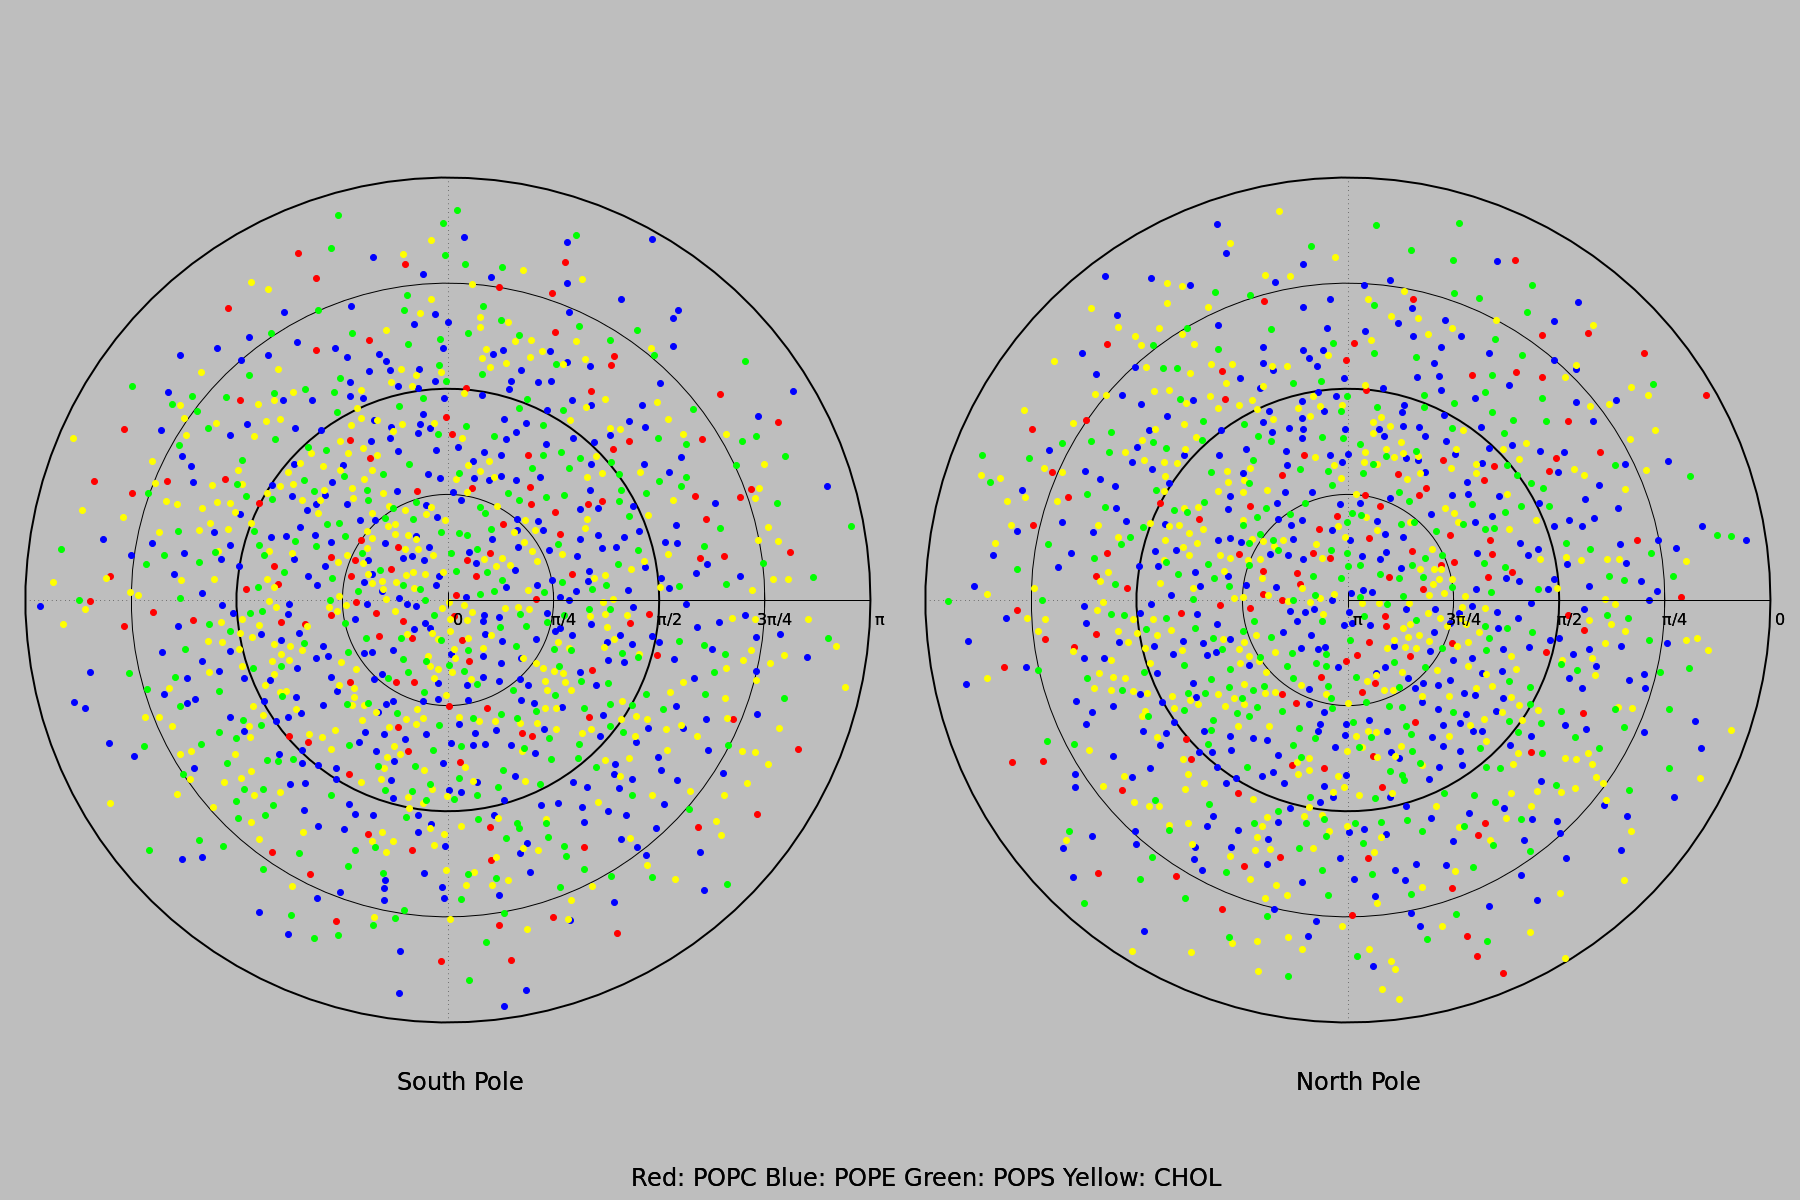
The coordinates and lipid types described in the PDB file example_frame.pdb may be combined with a binary “0” or “1” for whether the lipid is on the leaflet of interest to form an extended xyz file example_frame-leaflet.xyz. This can be visualized to produce the figure above as follows:
gnuplot -e "file='example_frame-leaflet.xyz'" polarPlot1.gnu
When there is reason to suspect a domain has formed on the vesicle, this can be checked by outlining lipids of a certain state (e.g. ordered vs disordered).
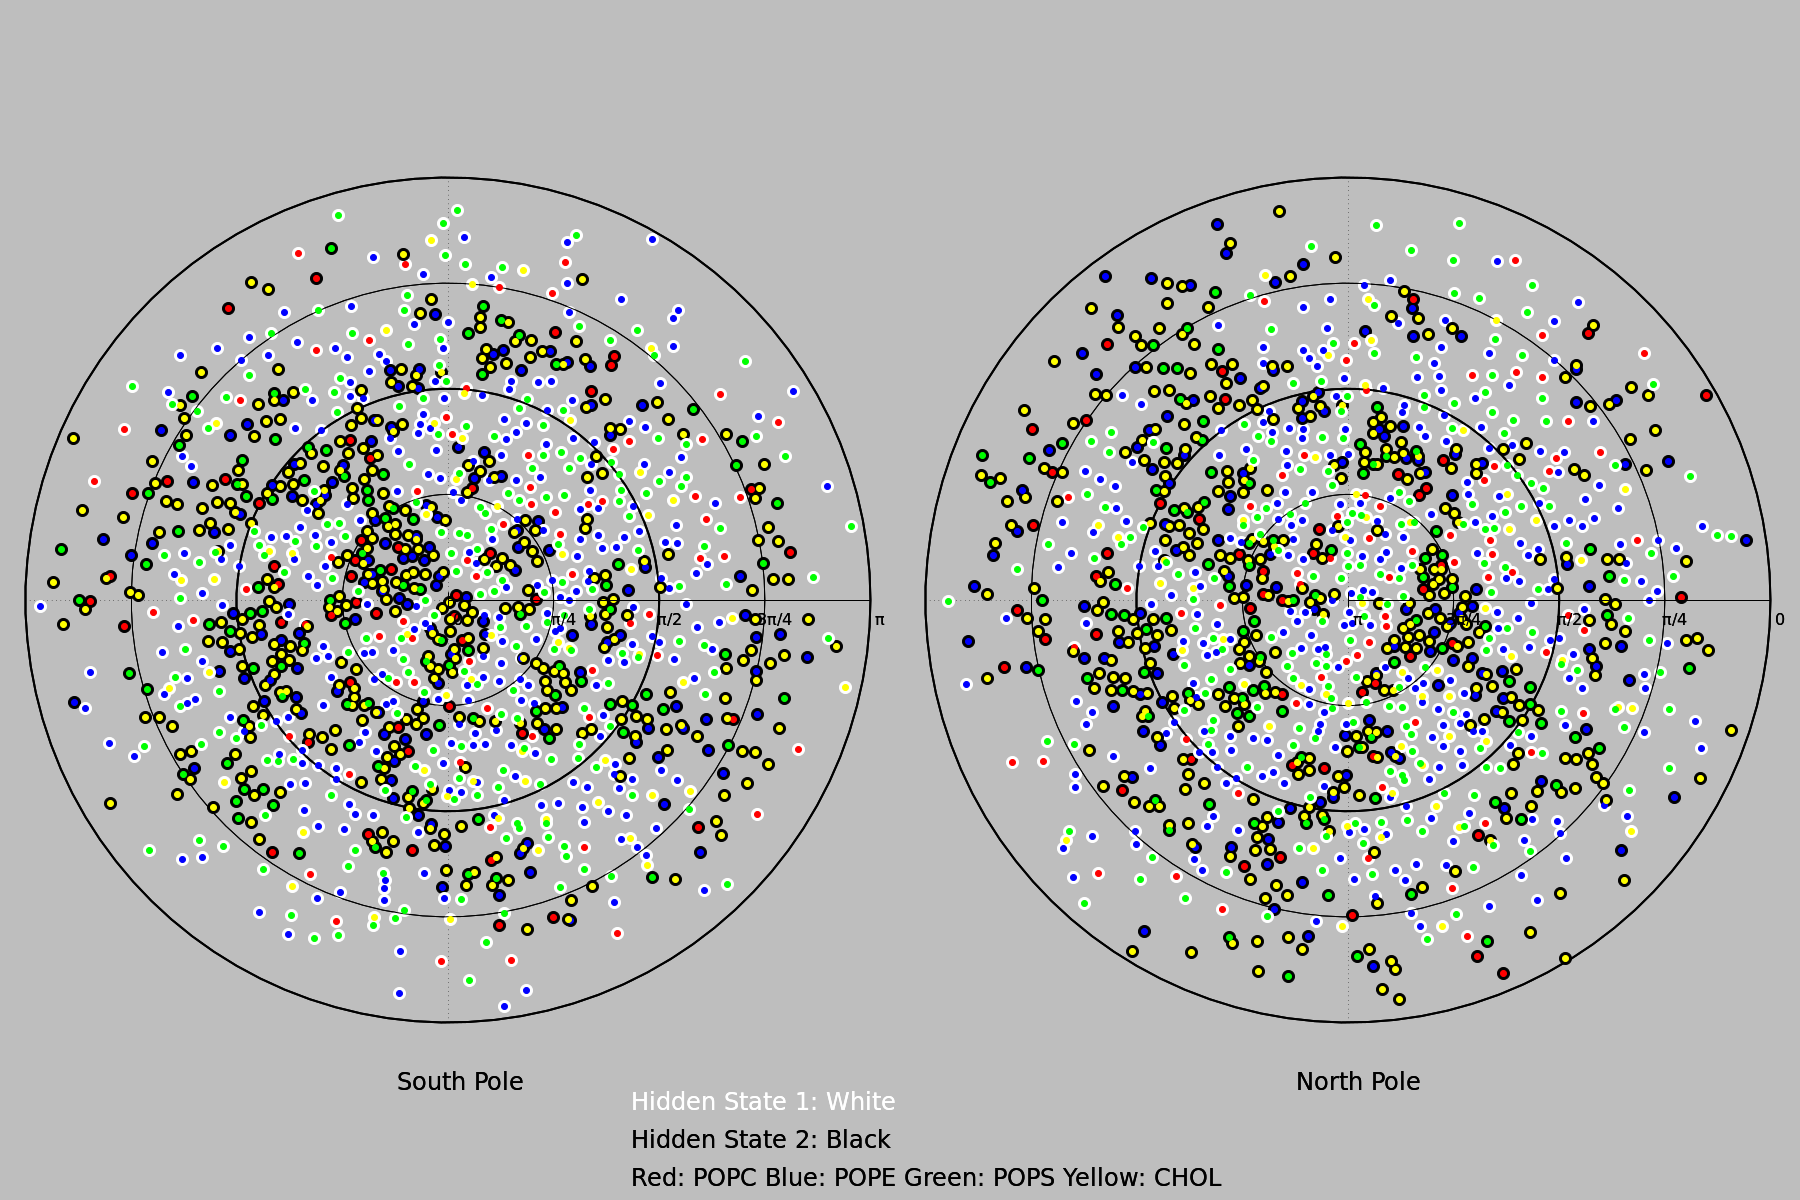
The coordinates and lipid types described in the PDB file example_frame.pdb may be combined with integer to represent which state it is in (or “0” to not display it at all) to form an extended xyz file example_frame-hiddenstates.xyz. This can be visualized to produce the figure above as follows:
gnuplot -e "file='example_frame-hiddenstates.xyz'" polarPlot2.gnu